I already knew what this module would be about since I participated in the Farbe, Licht und Interaktion module last semester which was also supervised by Florian Bachmann and Marcus Pericin. This module was for me a good opportunity to think of an art project, something my department at this university lacked. That was my motivation to enrol in the Fare & Licht im Raum module.
Unlike last time, I didn't had any project nor concept in mind; I just wanted to see what would inspire me. Quite early on I got confronted with a picture of a light installation, Connect the Dots, by Brigitte Kowanz at Haus Konstruktiv. The simplicity and cryptic aspect of it intrigued me; I found the concept of this art piece interesting, using light as a medium. I decided to base my project on hers, by using not only light but colour as well to communicate a message. The what, where and why weren't yet clear to me but that was the path I wished to follow.
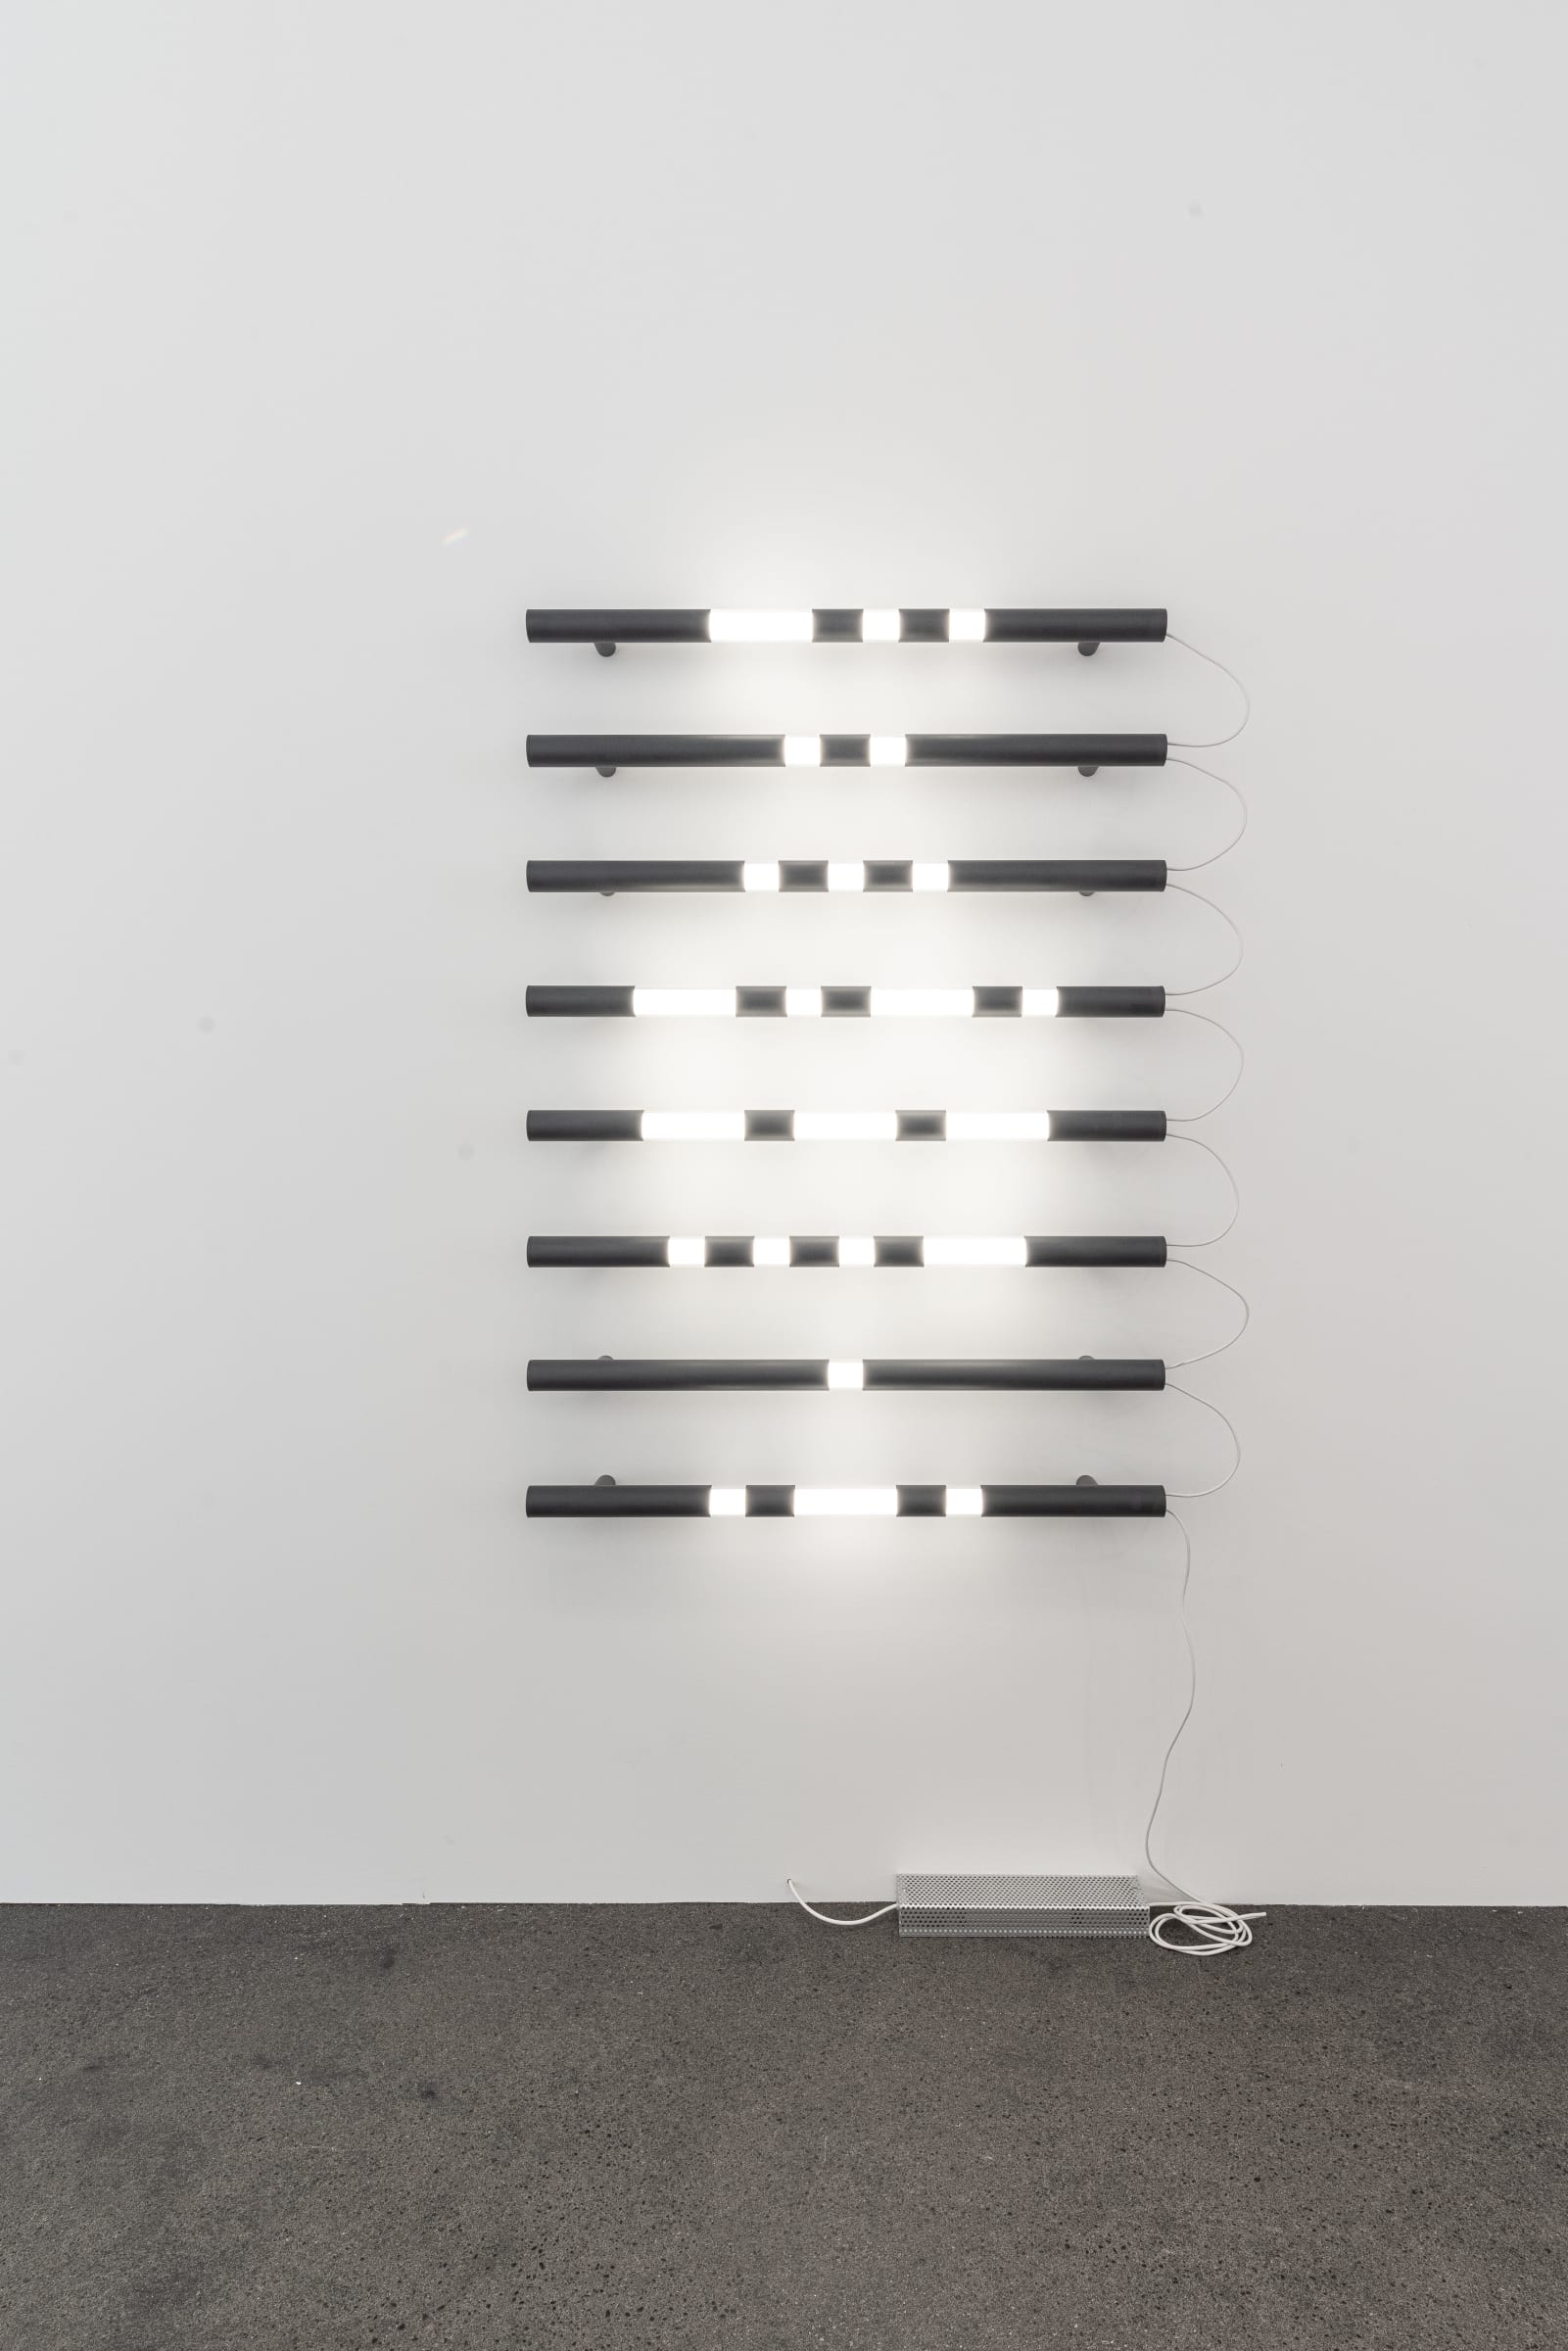 Connecting the Dots – Brigitte Kowanz
My approach to this concept was very pragmatic. In order to transcribe something into a light/colour language I would need to define a translation method, in other word an algorithm, which in itself to me implied code. From that rose a question; what do I want to encode: words, sound, images? Encoding sound would allow the art piece to maybe be interactive, an aspect I found could be interesting. What didn't appeal to me was how abstract the result would be; sound for a computer is already an abstraction of how we as humans perceive it and translating this abstraction into light would make the result feel too discombobulated, too cryptic. Words are also an abstraction of ideas but computers (more specifically assembly languages) and humans interpret them in a similar fashion. Encoding them would therefor make the result more understandable.
The next question I asked myself was what are words made of. Verbally they are a combination of sound which could then be transcribed in the International Phonetic Alphabet, but that definition would bring me back to translating sound. In most languages written words are simply a combination of symbols, of characters. This led me to learn how characters are used by a computer which then brought me to learn more about the ASCII chart, a common character encoding standard. Because the chart was developed in the US, it originally was only able to encode latin alphanumeric characters, basic punctuation and a set of control characters (line break, horizontal tabs, etc.).
 ASCII chart from a pre-1972 printer manual
Though I didn't know the text I wanted to encode yet, I knew that that text would either be written in English, French or German, which all use the Latin alphabet. The ASCII chart could therefor be used to encrypt.
I was now left with an important part of my project; how can I translate character into light/colour language? I needed to come up with a light/colour language with a set of rules that would allow me to use it. I based this language on the ASCII chart structure in which every character is referred to with an index. Colours in computer language are often described by a hexadecimal number, the first digit contains the red value, the second, the green and the last, the blue. The ASCII chart is also build on a hexadecimal base, making the conversion from one system to the other easier.
At that point the whole project seemed quite clear and simple in my head. What I needed to do was to simply convert the ASCII chart to an array and use the hexadecimal index of each character as its colour. Thinking that this approach would work I started coding both an encoding and decoding algorithm. I decided to code in Javascript because I knew it would work in a browser, making the code easy to access from any device.
The code in a vacuum worked as intended but when using a camera input, the decoding algorithm outputted gibberish. My first guess was that there were too many available characters and therefor too many available colours. I reduced to chart from 128 characters to only 82 but I faced the same issue. At this point the encoding algorithm combined the RGB channels in one single colour, making it harder for the decoding algorithm to operate properly. To facilitate the decoding I changed the encoding function so that it would output each colour channel separately. This didn't solve the problem but made the decoded text look slightly closer to its original. I then thought that this lack of precision might be due to the auto-white balance of the camera I was using. To fix the issue I had a look at how auto-white balance algorithms work. It turns out that there are hundreds of fascinating algorithms which all generally proceed in the same fashion; they first estimate the scene illumination and then apply the correction they came up with to the image. To counter the auto-white balance of my camera I added four reference colours (black, red, green, and blue) to the colour my decoding algorithm was reading and used those to estimate to actual colour of the character. For the first time the output of the function looked like text. It was still gibberish but the 'words' or groups of random characters were now separated by spaces which was already a big improvement.
Happy with the improvements I had made to the code, I started to think about the theme of my project. While coding the algorithms the idea of misinformation in the Information Age came to me and the more I thought about it, the more it seemed to fit my project. The latter showed how fragile information can be, how easy it is to distort its meaning. The decoding algorithm relayed the information it received without questioning it, becoming an active unintentional spreader of misinformation. By obstructing the camera, one could change the outputted text, a person reading the text afterwards might notice that it had been altered but wouldn't be able to trace those tampering back to their source.
As for the text I translated I choose one that explained the different types of misinformation and their uses, Misinformation in Social Media: Definition, Manipulation, and Detection written by Liang Wu, Fred Morstatter†, Kathleen M. Carley, and Huan Liu. In retrospect, I think a live newsfeed would have brought something new to the project and would have been more in keeping with it.
My algorithm was already rather reliable but its translation was not close enough to the original text. A problem I still had was the auto-brightness setting build into my camera. This setting would constantly change how the colours are perceived, the brighter colours were too dark and the dark ones, too bright. Finding no solution to disable this setting on my webcam I rented an actual camera with a manual mode which I then connected to my computer. The decoded text became slightly better but I knew that somehow I could still improve it.
To make the text more understandable I had a look at the frequency of each letter in the English language. This approach would increase the chance of the most common letters to be decoded properly, making the outputted text more readable. I decided to include it in my code by giving each character a frequency of appearance. For the letters I use the frequency of each letter in English texts according to the wikipedia page on letter frequency, all the other characters have the 'same' frequency.
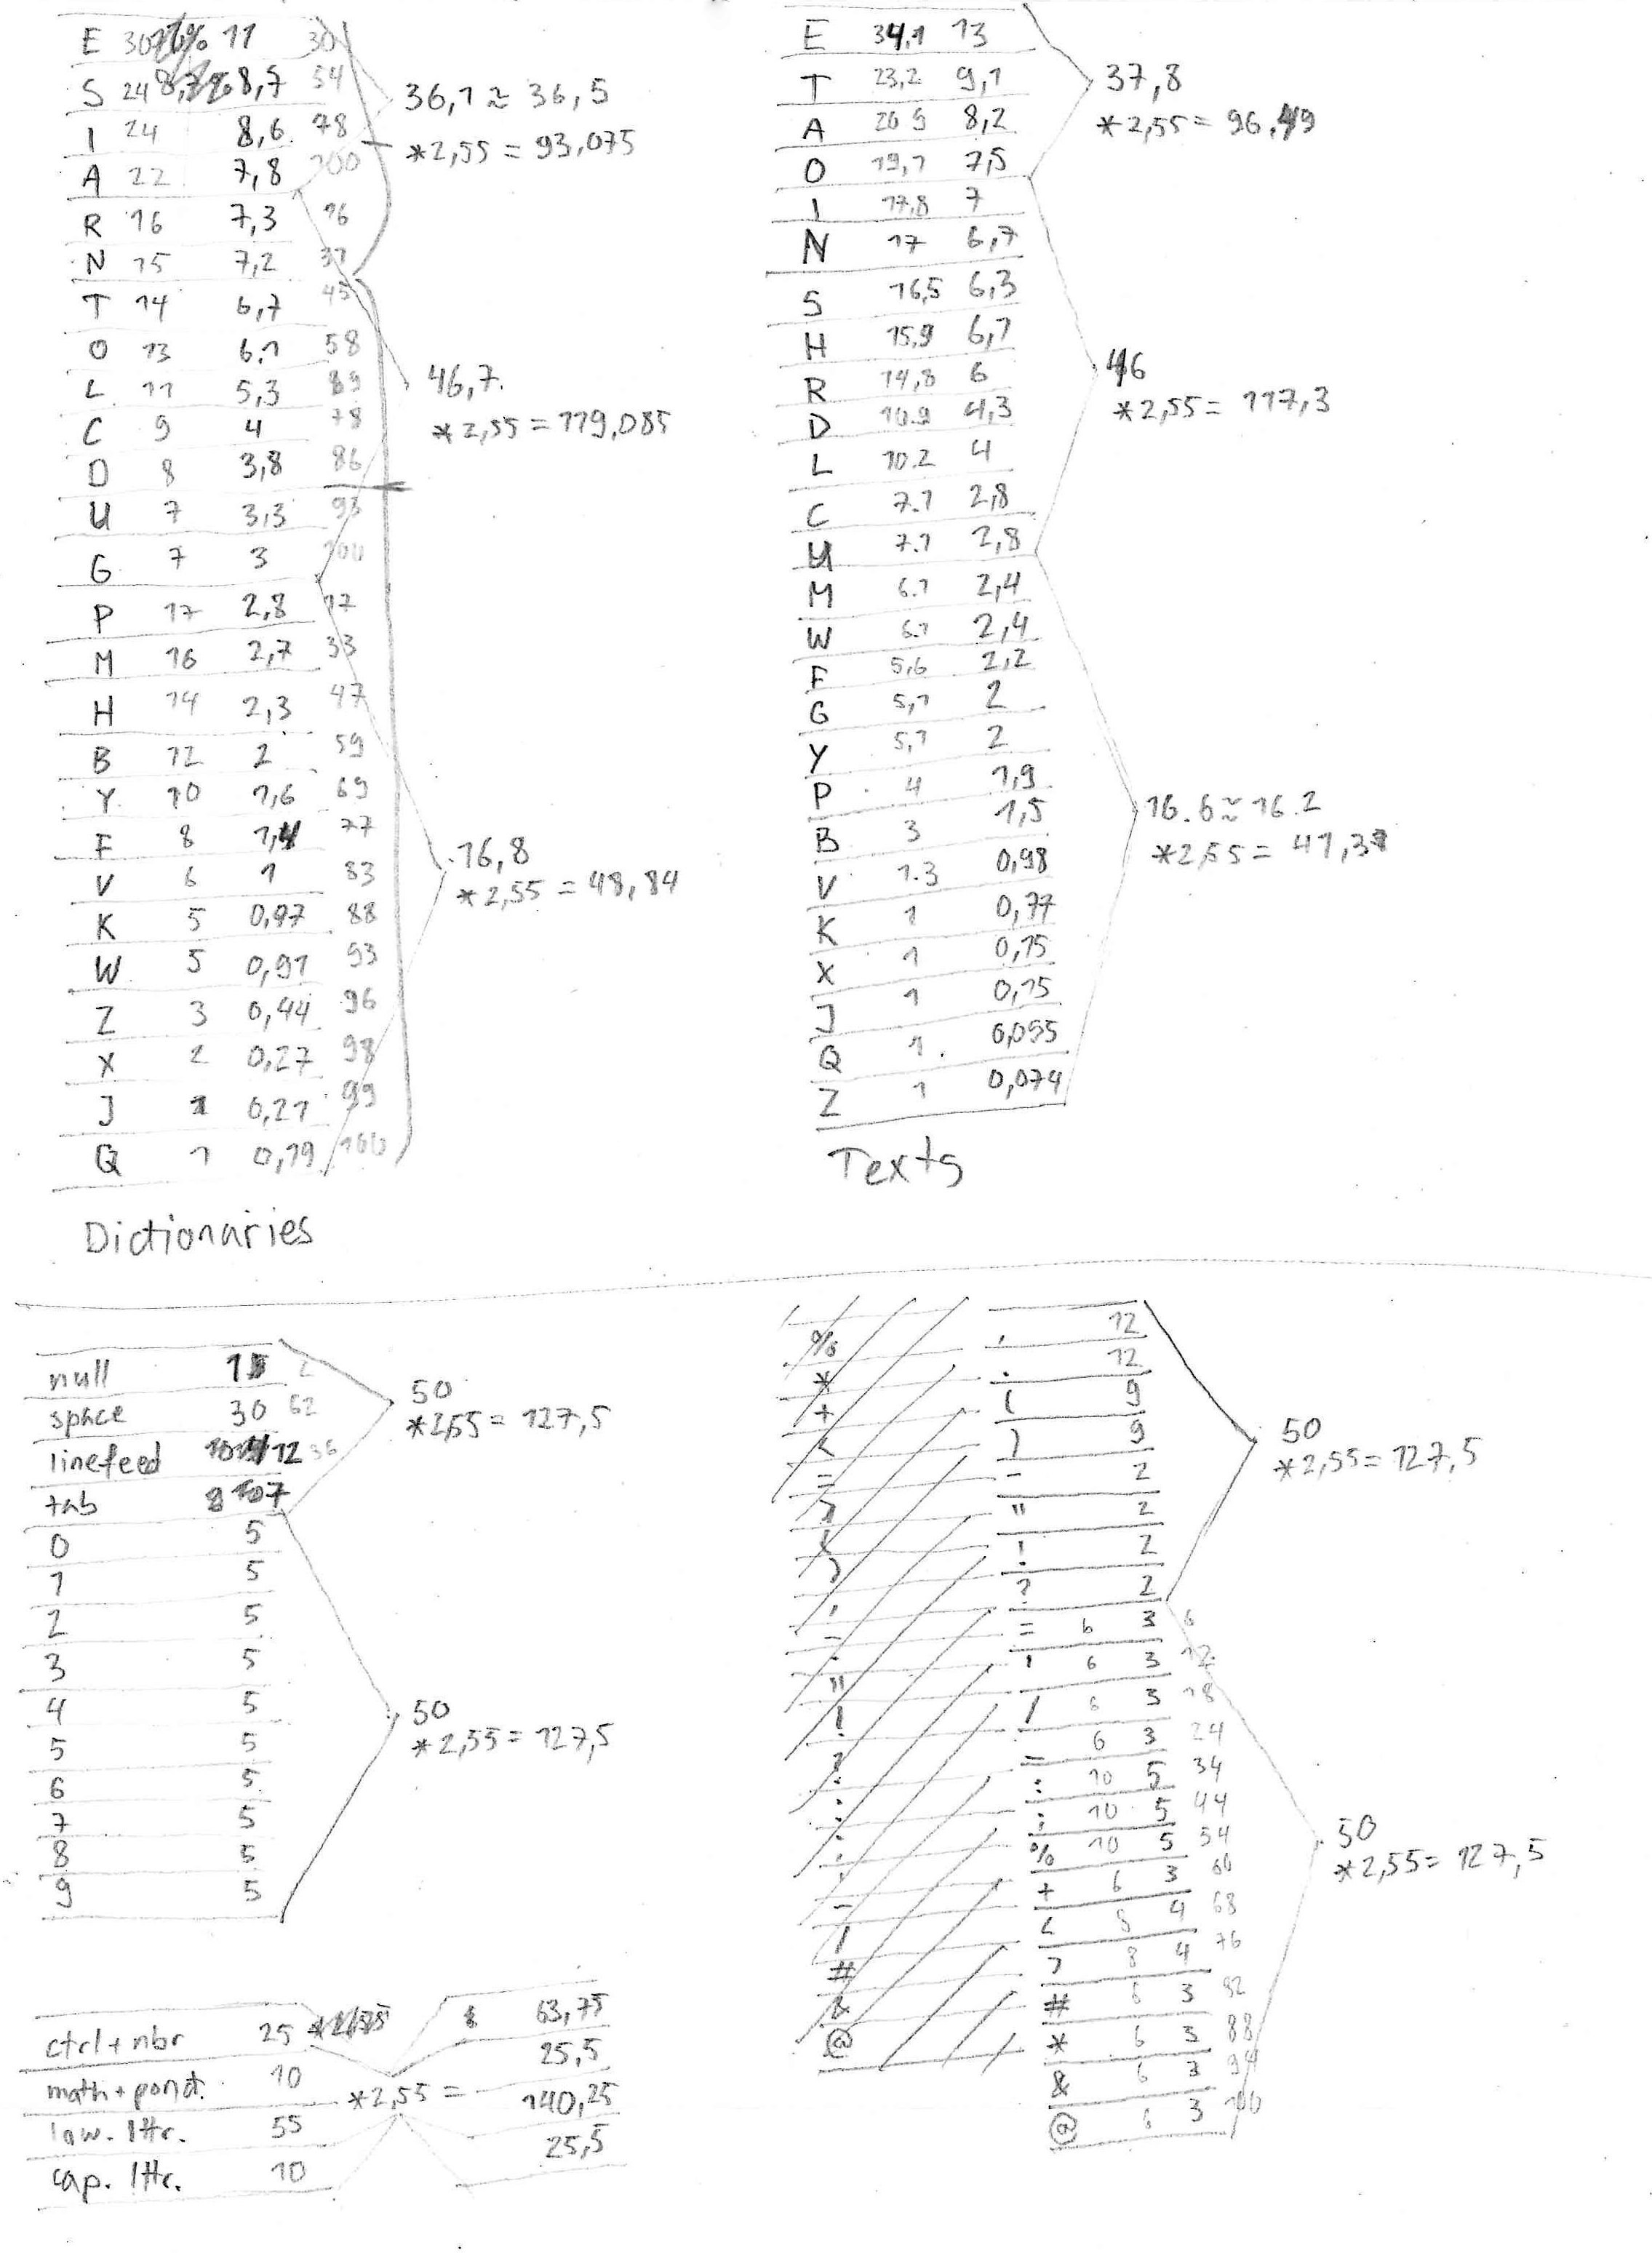 First list showing each character frequency.
I then divided my altered ASCII chart into categories and subcategories, this allowed me to reduce the amount of possible values per colour channel. The first colour channel would give me the general category of the character (4 categories), the second channel would define the subcategory (4 subcategories per category) and the last channel, which character in the subcategory (2-6 options per subcategory). The last channel needed to be the most accurate of the three. A camera has two times more green sensors than blue or red ones, I therefor choose green as my third channel. red defined the category and blue the subcategory. Hereafter is a chart visualising the encoded characters. You'll notice that I've remove the capital letters, they made the whole algorithm less precise.
Controls & Basic punctuation
Controls p.1
NULL
SPACE
Controls p.2
LINEFEED
.
Basic ponctuation p.1
(
)
,
Basic ponctuation p.2
-
"
?
Numbers & Special glyphs
Numbers p.1
0
1
2
Numbers p.2
3
4
5
6
Numbers p.3 & /
7
8
9
/
Special glyphs
:
;
%
@
Alphabet p.1
Alphabet p.1.1
a
b
c
Alphabet p.1.2
d
e
Alphabet p.1.3
f
g
h
Alphabet p.1.4
i
j
k
l
m
Alphabet p.2
Alphabet p.2.1
n
o
Alphabet p.2.2
p
q
r
Alphabet p.2.3
s
t
Alphabet p.2.4
u
v
w
x
y
z
This change fairly improved the output, the words were still not perfectly translated but one could still understand them in the context. I was satisfied. My project was now ready to be exhibited. The project can be found at the following address.